Specify sensory table
df <- specify(
 data = perfume_qda_consumers,
 sensory_method = "QDA",
 panelist = consumer,
 product = product,
 attribute = intensity:green,
 hedonic = NULL
)
df
#> # A sensory table: <1236 x 23>
#> # Sensory method:  Quantitative Descriptive Analysis
#> # Panelist:        consumer <103 subjects>
#> # Product:         product <12 items>
#> # Attribute:       intensity, freshness, jasmin, ro...<21 lexicons>
#> # Hedonic:         None
#>    consumer product intensity freshness jasmin  rose camomille fresh_lemon
#>    <fct>    <fct>       <dbl>     <dbl>  <dbl> <dbl>     <dbl>       <dbl>
#>  1 171      Angel        77        36.1   30    13.3      15.2        15.2
#>  2 171      Aromat…      69.7      26.7   75.2  17.9      15.5        16.7
#>  3 171      Chanel…      52.7      50.6   41.5  45.8      18.8        17.6
#>  4 171      Cinema       70        60.9   26.4  21.8      18.8        20.6
#>  5 171      Coco M…      73        66.1   40.6  18.2      15.2        15.2
#>  6 171      J'ador…      61.8      58.5   30    14.2      16.7        20.9
#>  7 171      J'ador…      48.8      50.9   46.1  48.2      18.2        22.7
#>  8 171      L'inst…      67.3      22.7   15.8  16.1      14.5        36.1
#>  9 171      Lolita…      76.7      19.1   27.9  17        16.1        16.7
#> 10 171      Pleasu…      52.4      67.6   49.4  62.7      20.9        46.4
#> # … with 1,226 more rows, and 15 more variables: vanilla <dbl>,
#> #   citrus <dbl>, anis <dbl>, sweet_fruit <dbl>, honey <dbl>,
#> #   caramel <dbl>, spicy <dbl>, woody <dbl>, leather <dbl>, nutty <dbl>,
#> #   musk <dbl>, animal <dbl>, earthy <dbl>, incense <dbl>, green <dbl>
Local analysis
qda_local <- analyse(df, "local")
qda_local
#> # Local analysis:
#> # Sensory method:    Quantitative Descriptive Analysis
#> # Analytical method: Analysis of variance
#> # Model:             Attribute ~ Product + Panelist
#>    attribute statistic  p.value Angel `Aromatics Elix… `Chanel N5` Cinema
#>    <chr>         <dbl>    <dbl> <dbl>            <dbl>       <dbl>  <dbl>
#>  1 freshness     16.6  1.38e-30  41.9             44.2        48.0   52.7
#>  2 intensity     13.5  2.02e-24  68.2             68.3        66.1   53.6
#>  3 leather       13.0  1.83e-23  30.4             28.1        21.3   19.7
#>  4 earthy        12.4  3.06e-22  28.8             26.7        20.6   17.2
#>  5 vanilla       11.9  2.98e-21  37.0             26.0        29.7   38.6
#>  6 woody         11.4  2.64e-20  37.2             35.3        27.2   25.7
#>  7 spicy         10.4  2.99e-18  43.6             46.7        40.4   34.4
#>  8 incense        9.44 2.05e-16  33.3             31.4        29.4   25.7
#>  9 caramel        9.08 1.08e-15  33.0             22.8        24.2   26.3
#> 10 animal         8.56 1.17e-14  27.8             25.0        19.4   19.8
#> # … with 11 more rows, and 8 more variables: `Coco Mademoiselle` <dbl>,
#> #   `J'adore EP` <dbl>, `J'adore ET` <dbl>, `L'instant` <dbl>, `Lolita
#> #   Lempicka` <dbl>, Pleasures <dbl>, `Pure Poison` <dbl>, Shalimar <dbl>
visualise(qda_local, min_scales = 0, max_scales = 100)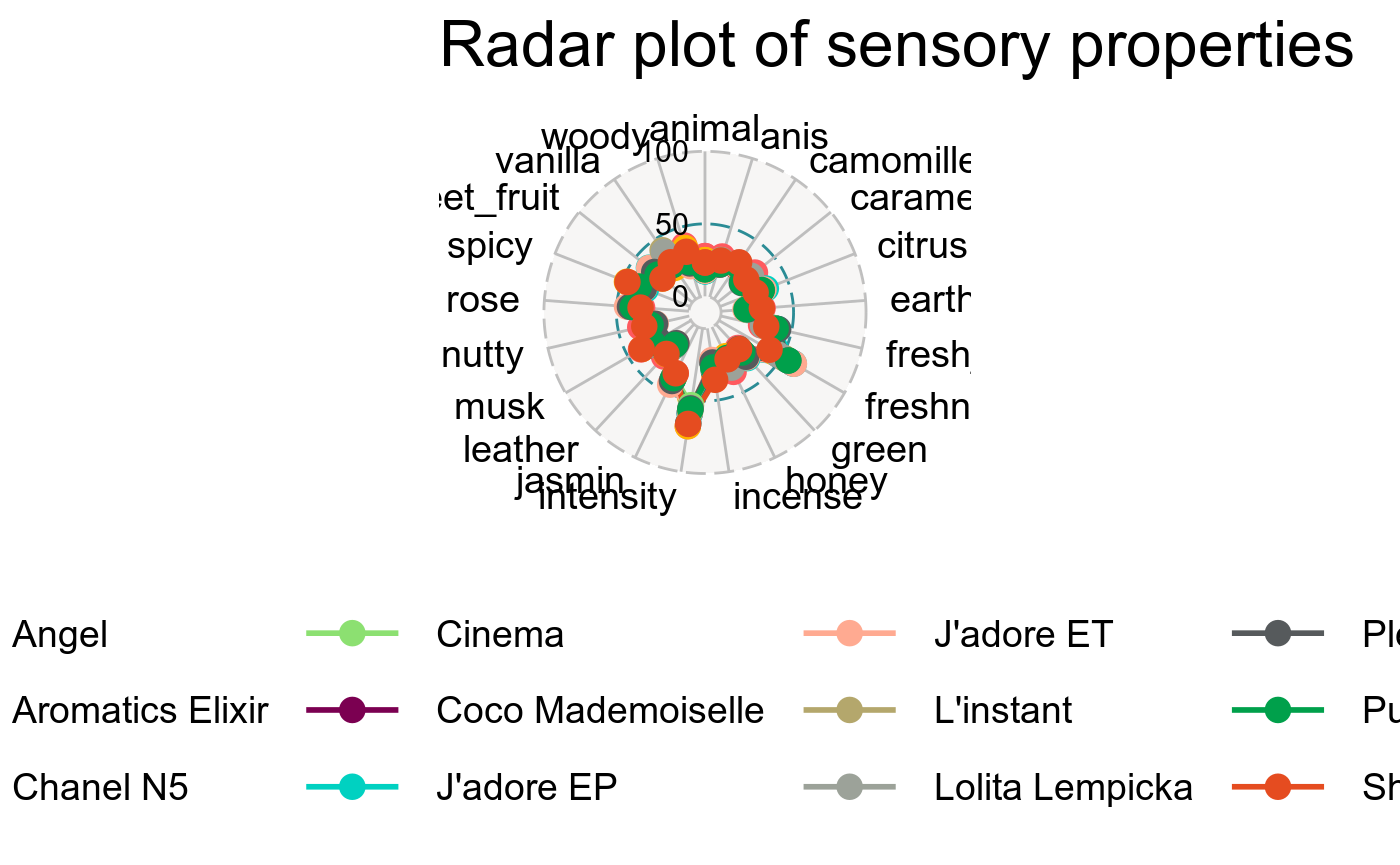
Global analysis
qda_global <- analyse(df, "global")
qda_global
#> # Global analysis:
#> # Sensory method: Quantitative Descriptive Analysis
#> # Analytical method: Principal Component Analysis
#> # Active individual: 12 items
#> # Active variable: 21 lexicons
#> # Supplementary variable: None
#> #
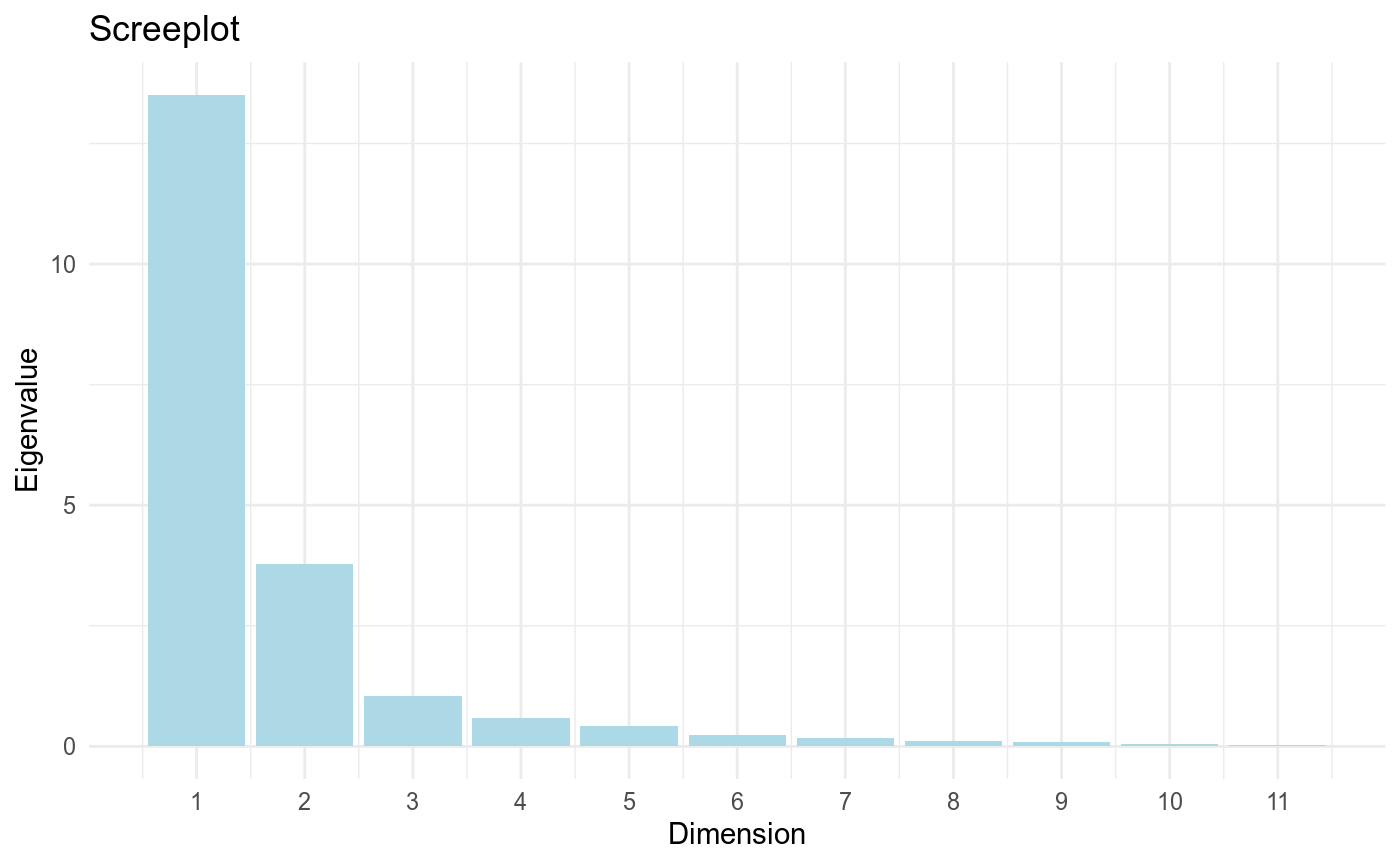
#> # Description of: Eigenvalue
#> # Number of dimension: 11
#> dimension eigenvalue pct_variance pct_cum_variance
#> <dbl> <dbl> <dbl> <dbl>
#> 1 1 13.5 67.5 67.5
#> 2 2 3.77 18.9 86.4
#> 3 3 1.04 5.22 91.6
#> 4 4 0.581 2.91 94.5
#> 5 5 0.422 2.11 96.6
#> 6 6 0.232 1.16 97.8
#> 7 7 0.170 0.852 98.7
#> 8 8 0.116 0.580 99.2
#> 9 9 0.0849 0.425 99.7
#> 10 10 0.0405 0.202 99.9
#> 11 11 0.0266 0.133 100
#> #
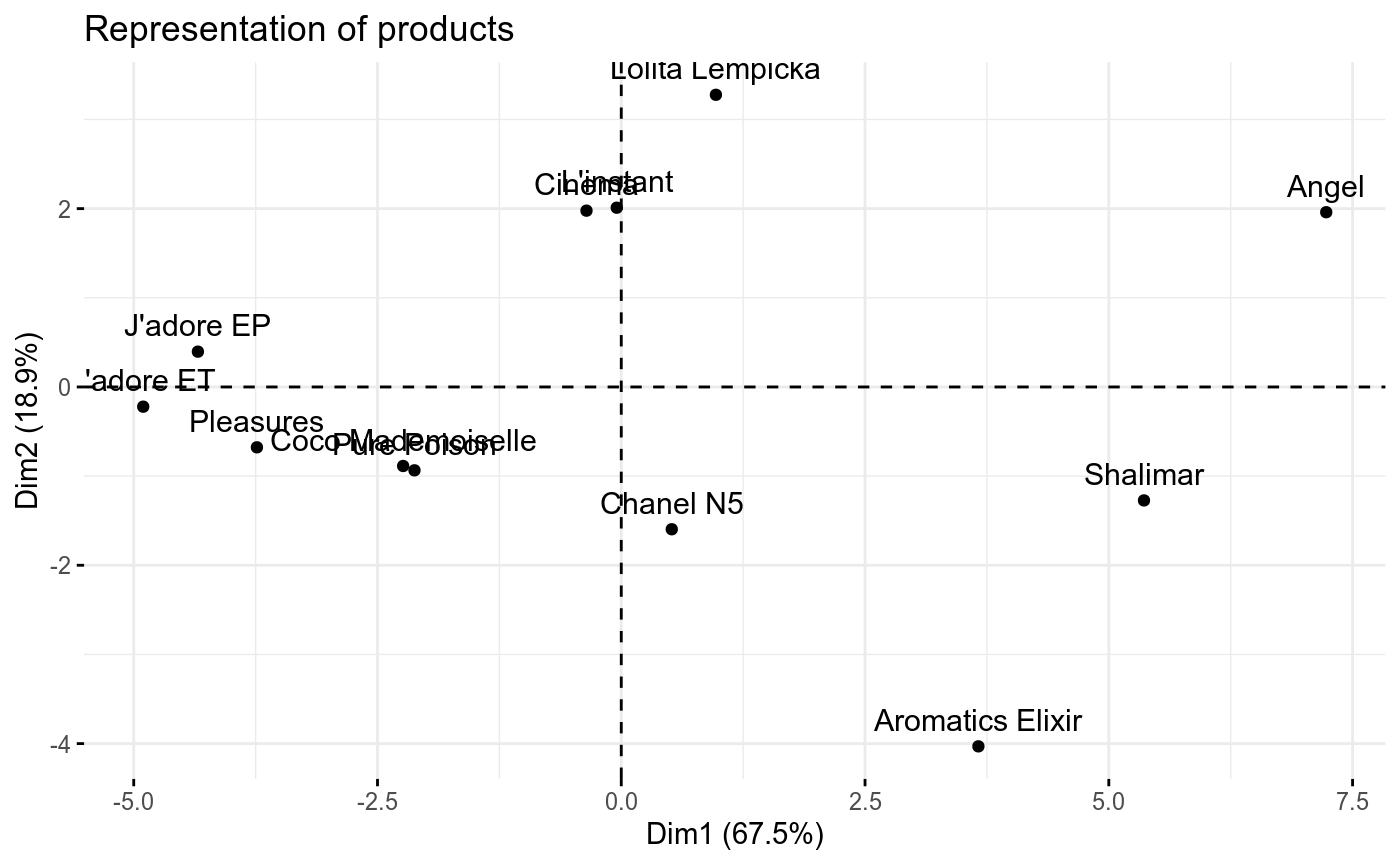
#> # Description of: Product <12 items>
#> # Dimension: Dim 1 x 2
#> product dim1 dim2 quality contribution
#> <chr> <dbl> <dbl> <dbl> <dbl>
#> 1 Angel 7.23 1.96 0.932 27.1
#> 2 Shalimar 5.36 -1.27 0.895 14.6
#> 3 Aromatics Elixir 3.66 -4.03 0.947 14.3
#> 4 J'adore ET -4.90 -0.221 0.880 11.6
#> 5 J'adore EP -4.34 0.396 0.874 9.17
#> 6 Pleasures -3.74 -0.677 0.901 6.95
#> 7 Lolita Lempicka 0.971 3.28 0.844 5.63
#> 8 Coco Mademoiselle -2.24 -0.887 0.682 2.79
#> 9 Pure Poison -2.12 -0.935 0.759 2.59
#> 10 L'instant -0.0464 2.01 0.670 1.95
#> 11 Cinema -0.357 1.98 0.495 1.95
#> 12 Chanel N5 0.518 -1.60 0.480 1.36
#> #
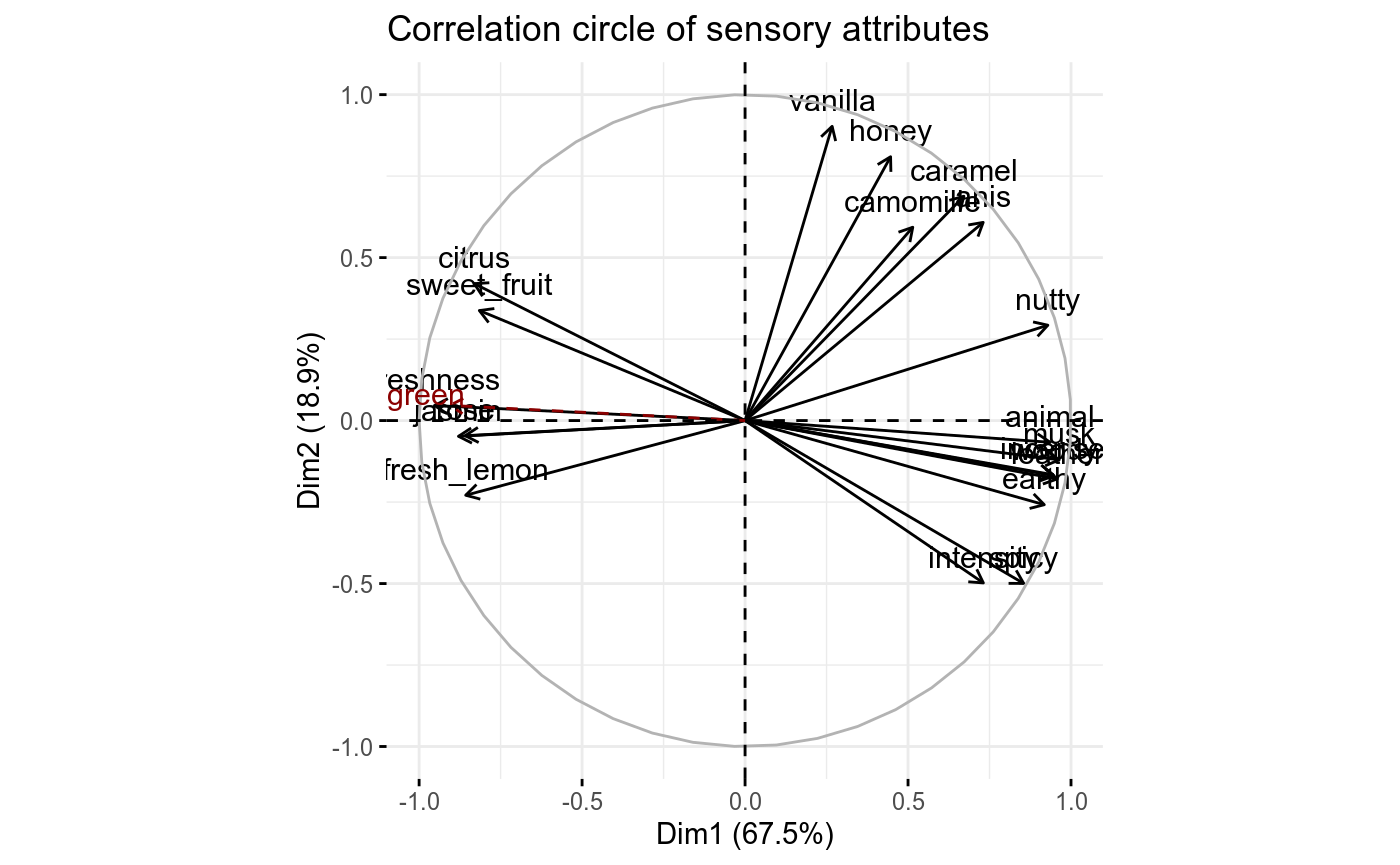
#> # Description of: Sensory attribute <20 lexicons>
#> # Dimension: Dim 1 x 2
#> attribute dim1 dim2 quality contribution
#> <chr> <dbl> <dbl> <dbl> <dbl>
#> 1 spicy 0.855 -0.500 0.980 5.67
#> 2 leather 0.957 -0.179 0.949 5.49
#> 3 nutty 0.929 0.293 0.948 5.49
#> 4 musk 0.964 -0.121 0.943 5.46
#> 5 woody 0.948 -0.169 0.927 5.37
#> 6 caramel 0.671 0.688 0.924 5.35
#> 7 incense 0.944 -0.166 0.919 5.32
#> 8 freshness -0.953 0.0462 0.910 5.27
#> 9 earthy 0.918 -0.258 0.909 5.26
#> 10 anis 0.731 0.608 0.903 5.23
#> 11 vanilla 0.267 0.903 0.886 5.13
#> 12 animal 0.936 -0.0667 0.881 5.10
#> 13 citrus -0.831 0.420 0.867 5.02
#> 14 honey 0.446 0.809 0.854 4.94
#> 15 fresh_lemon -0.857 -0.229 0.787 4.55
#> 16 intensity 0.731 -0.498 0.783 4.53
#> 17 sweet_fruit -0.815 0.338 0.779 4.51
#> 18 jasmin -0.879 -0.0483 0.776 4.49
#> 19 rose -0.859 -0.0464 0.739 4.28
#> 20 camomille 0.515 0.593 0.617 3.57
visualise(qda_global, choice = "eigenvalue")