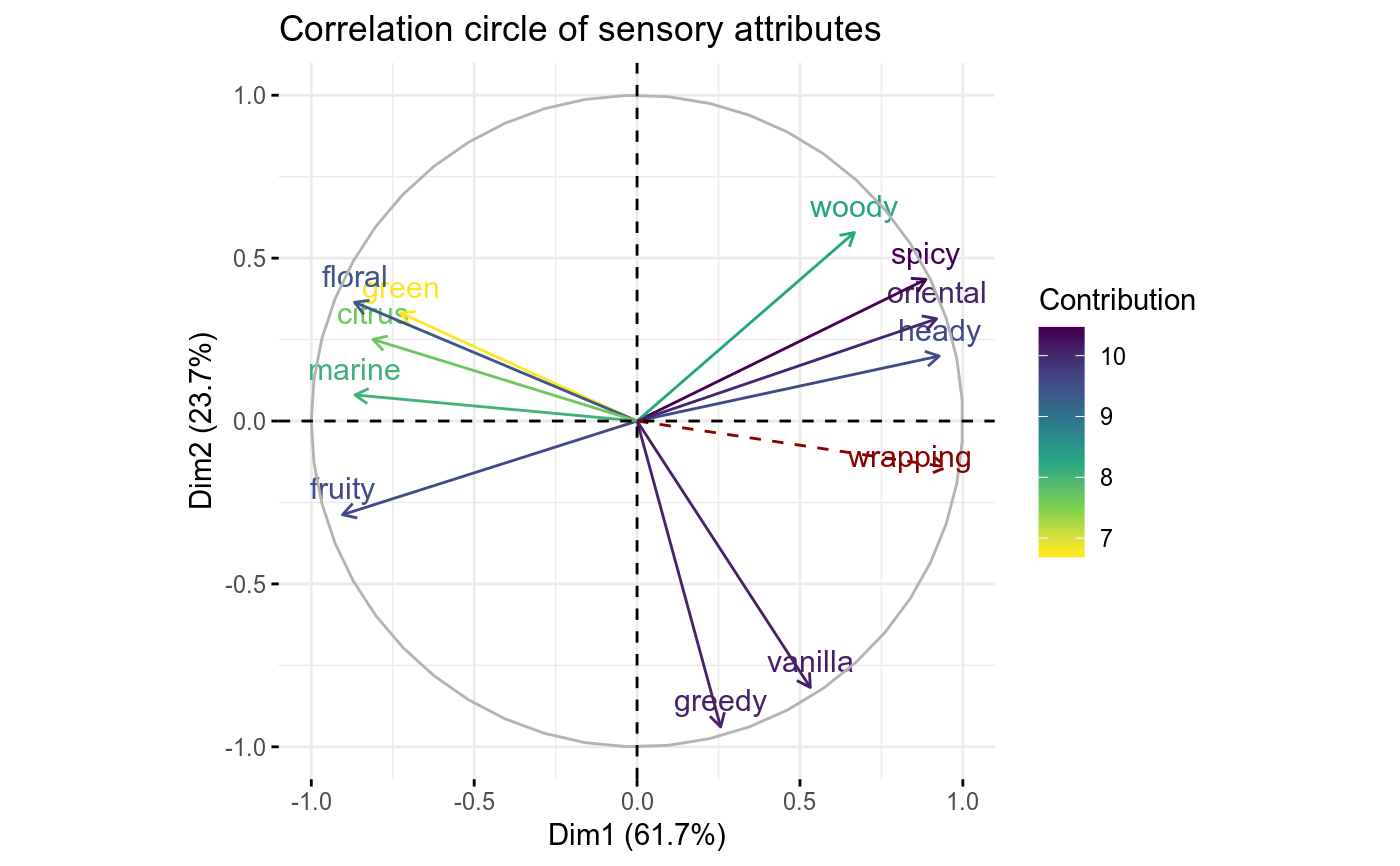
Plot product representations or attributes on sensory spaces.
# S3 method for tbl_sensory_global
visualise(res, choice = c("product",
  "attribute", "eigenvalue"), dimension = c(1, 2), repel = FALSE,
  colour_by = c("none", "quality", "contribution"), title = "default",
  ...)
Arguments
| res | output of global analysis |
|---|---|
| choice | component of interest, valid values are "product" and "attribute" |
| dimension | dimension to focus, integer vector of length 2 |
| repel | avoid overplotting of text label |
| colour_by | colour point or line based on specific properties, valid values are "quality" and "contribution" |
| title | a title to use in plot |
| ... | not yet implemented |
Value
a ggplot object
Examples
perfume_qda_experts %>%
  specify(
    sensory_method = "QDA",
    panelist = panelist,
    product = product,
    session = session,
    pres_order = rank,
    attribute = spicy:wrapping
  ) %>%
  analyse(choice = "global") %>%
  visualise(choice = "attribute", colour_by = "contribution")