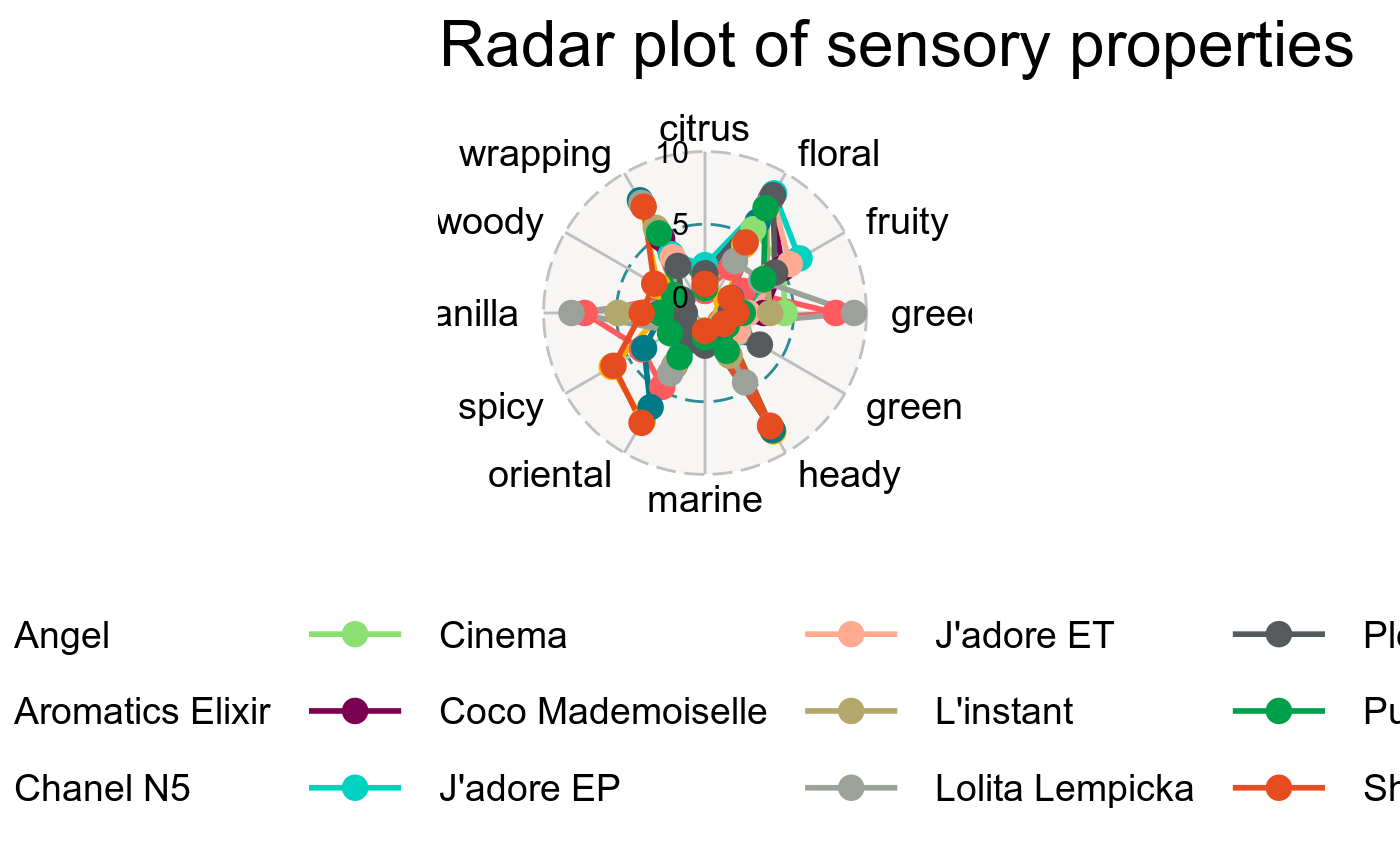
Create representation of sensory properties of each product in form of radar plot.
# S3 method for tbl_sensory_local
visualise(res, min_scales = 0,
  max_scales = 10, point_size = 4, line_width = 1,
  title = "Radar plot of sensory properties",
  legend_position = "bottom", ...)
Arguments
| res | result of local or global analysis |
|---|---|
| min_scales | minimum value of the scales |
| max_scales | maximum value of the scales |
| point_size | point size |
| line_width | line width |
| title | a title to use in plot |
| legend_position | position of legend, valid values are "top", "right", "bottom", and "left" |
| ... | not yet implemented |
Value
a ggplot object
Examples
perfume_qda_experts %>%
  specify(
    sensory_method = "QDA",
    panelist = panelist,
    product = product,
    session = session,
    pres_order = rank,
    attribute = spicy:wrapping
  ) %>%
  analyse(choice = "local") %>%
  visualise()