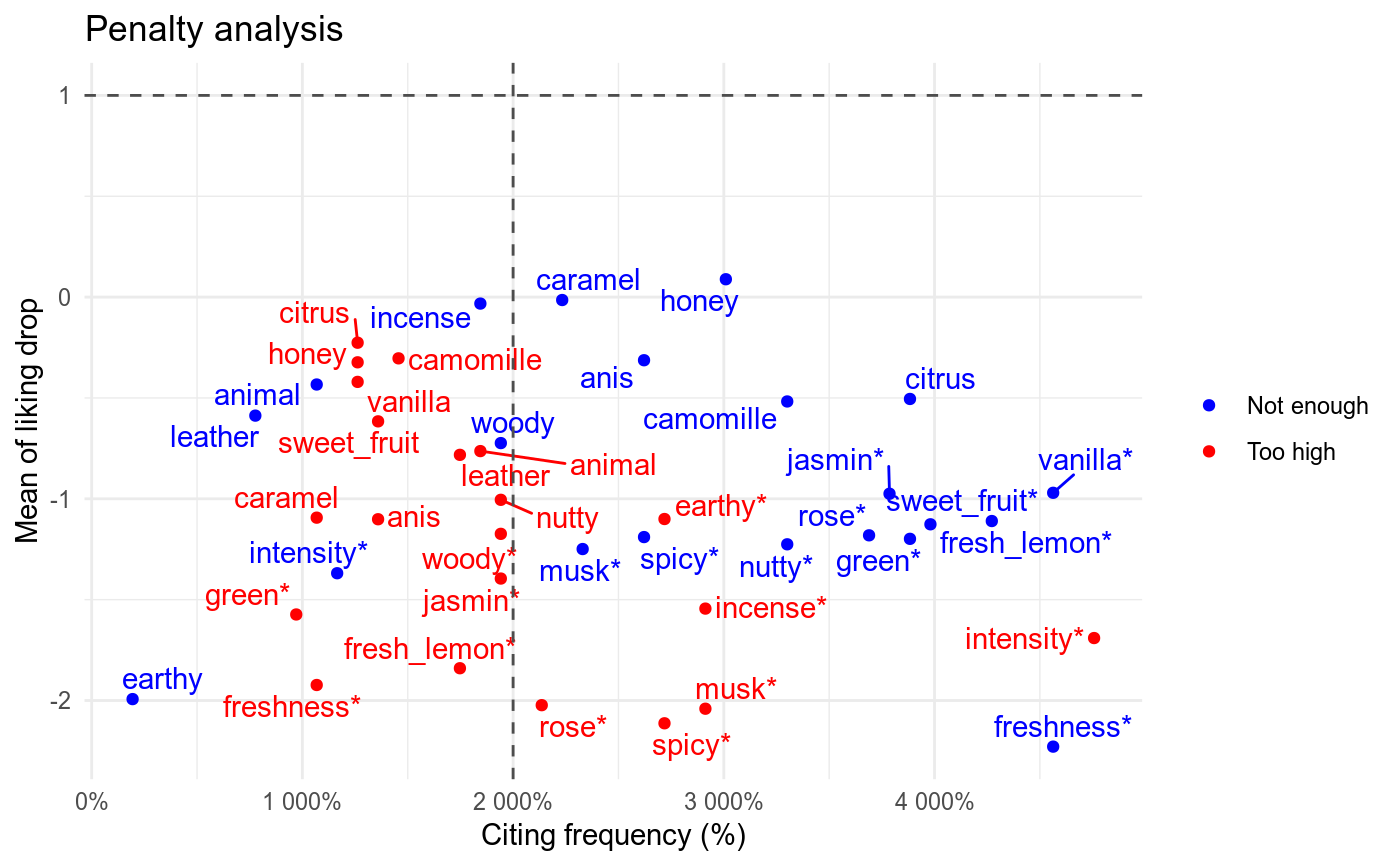
Plot liking drop and citing frequency from penalty analysis.
# S3 method for tbl_sensory_penalty
visualise(res, product,
  frequency_threshold = 20, drop_threshold = 1,
  title = "Penalty analysis", xlab = "Citing frequency (%)",
  ylab = "Mean of liking drop", ...)
Arguments
| res | output penalty analysis |
|---|---|
| product | product of interest (only one product) |
| frequency_threshold | threshold for citing frequency |
| drop_threshold | threshold for iking drop |
| title | a title to use in plot |
| xlab | label for x-axis |
| ylab | label for y-axis |
| ... | not yet implemented |
Value
a ggplot object
Examples
perfume_jar %>%
  specify(
    sensory_method = "JAR",
    panelist = consumer,
    product = product,
    attribute = intensity:green,
    hedonic = liking
  ) %>%
  analyse(choice = "penalty", ref_value = 0) %>%
  visualise("Chanel N5")